Nowadays, plastics are one of the most common materials in our daily life. Plastics have exceptional properties, which have made them indispensable in different industries (for example, packaging, building & construction, and automotive sector), resulting in societal benefits. However, the use of plastics generates plastic waste, and improper management of this waste leads to severe plastic pollution. In Hungary, there are some encouraging waste management trends, such as higher recycling and recovery rates and a decrease in the usage of landfills.
Without proper waste management, plastics end up in various ecosystems creating damage to our environment. Regeneration is the only tool to avoid the dispersion of waste in the world, thus contributing to the protection of our planet. We need to change the way we act about the use and disposal of resources.
– Silvia Merighi, founder of MSP Group, the broker in the plastic recycling sector
Plastic production
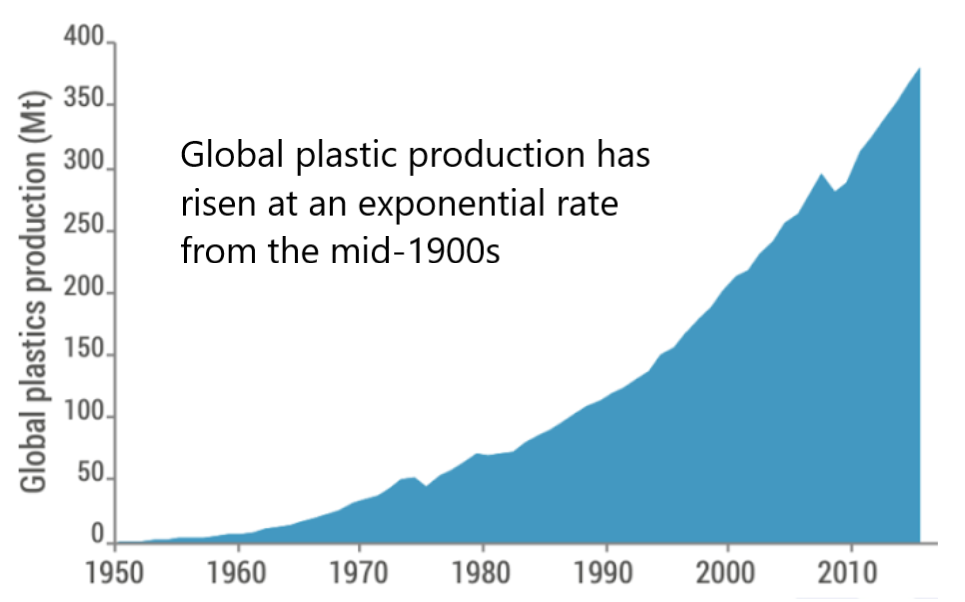
Global plastic production has risen at an exponential rate due to its usability and functionality (see Graph 1). In 1950 the production of plastics was approximately 2 million tonnes (Mt). However, in 2019 it reached 368 million tonnes.
The top plastic producer was China accounting for 31% of the global plastic production. NAFTA was the second-largest plastic producing region accounting for 19%, while Europe’s share was 17%.
Global plastic production has risen at an exponential rate from the mid-1900
Graph 1 – Global plastic production, in million tonnes.
Plastics consumption
Speaking of plastics consumption distribution across the world, in 2016, NAFTA and China were among the largest plastic consumers with shares of 21% and 20% respectively, followed by Western Europe that accounted for 18%.
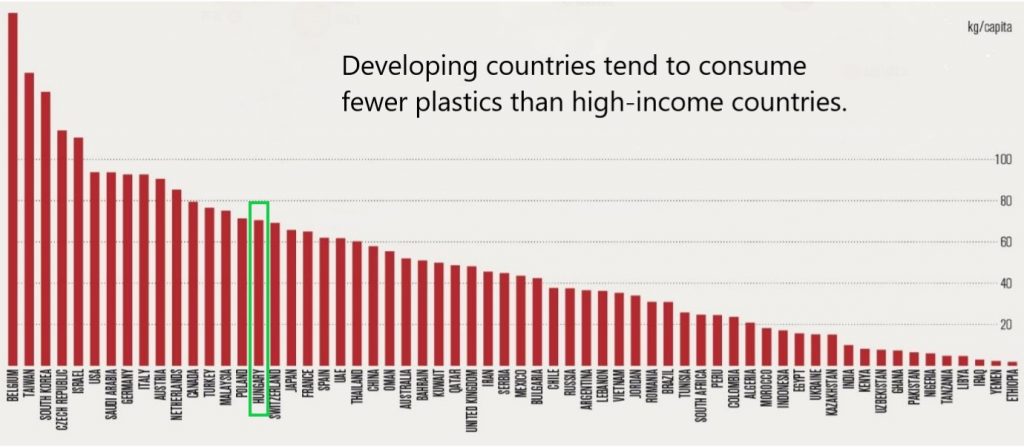
Graph 2 shows the plastic consumption by country per person in 2015 (volume of consumption divided by population). It demonstrates that developing countries tend to consume fewer plastics than high-income countries. As we see, China ranks lower than other countries. However, high-income countries usually manage plastic waste more effectively than poorer countries.
Graph 2 – Plastic consumption by country per capita in 2015, in kg per capita.
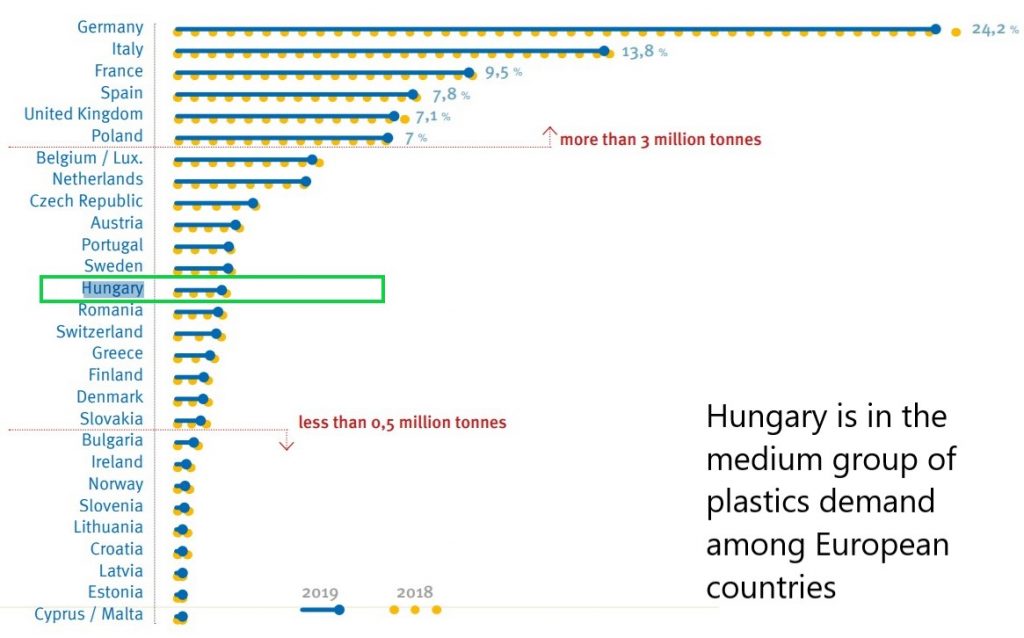
Graph 3 represents plastic demand distribution across Europe (EU28) in 2018-2019. Overall European demand was 50.7 Mt. Germany had the highest demand for plastics among European countries, accounting for almost one-quarter of the European plastics demand. The first six countries in the graph accounted for almost 70% of the European demand.
Graph 3 – Plastics market demand among European countries in 2018 compared to 2019, in percentage.
Hungary’s plastics market
According to Euromap (Graph 4), plastics production in Hungary fluctuated between 1 and 1.2 Mt from 2009 to 2015. Plastics consumption slightly increased from 0.631 Mt in 2009 to 0.695 Mt in 2015.
Graph 4 – Plastic production and consumption in Hungary, in million tonnes.
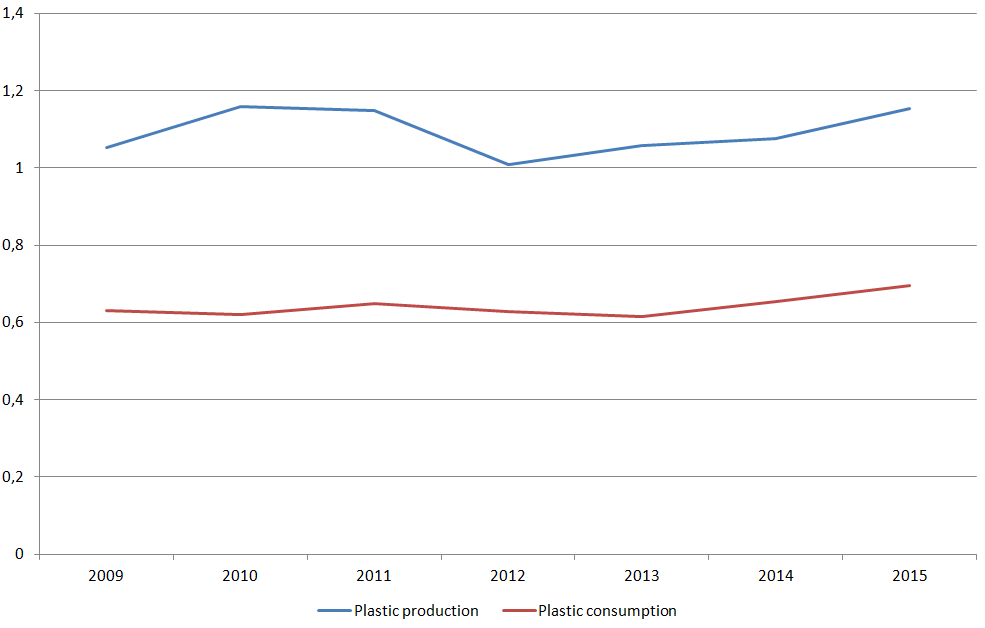
In terms of consumption per capita, the rate grew over time from 62.9 in 2009 to 70.5 kg/capita in 2015, which is less than the US, Italy, Germany, but more than in France, UK, and Spain (see Graph 2).
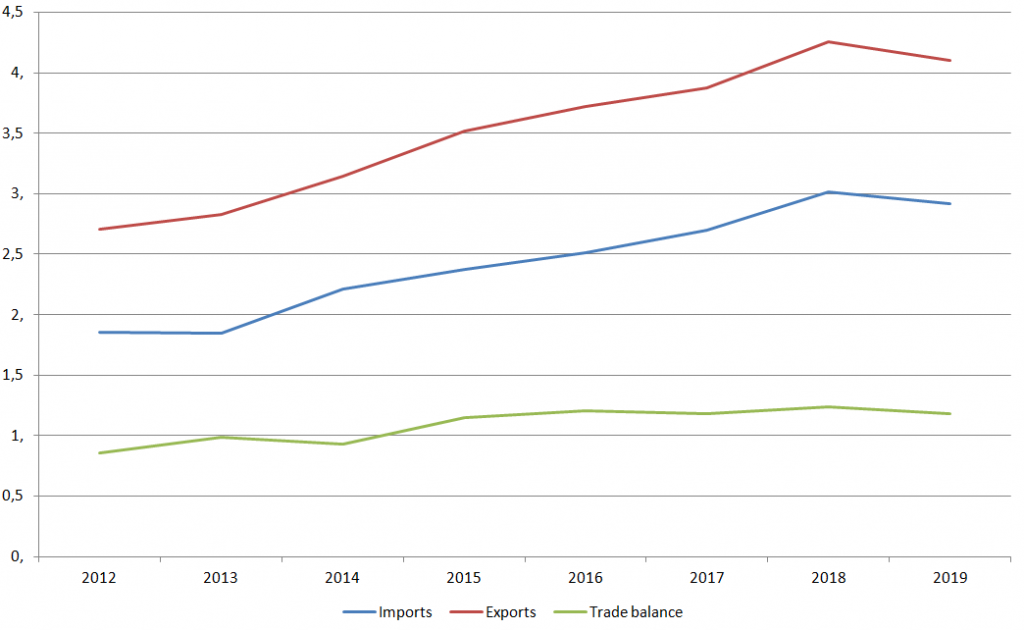
Graph 5 shows that the plastic industry in Hungary has a positive trade balance. In 2015, it reached more than one bn EUR. The import and export of rubber and plastic products increased from 2012 to 2018. In 2019, it experienced a slight decline.
Graph 5 – Plastic and rubber products trade in Hungary, in billion EUR.
According to IBISWorld, in 2021, the market size of the Primary Form Plastics Manufacturing in Hungary, measured by revenue, was 2.2bn EUR, which was quite small compared to Germany (31.7 bn EUR) or the Netherlands (15.7 bn EUR), 44 businesses were operating in this sector with 4162 employees.
Plastic waste Management in Hungary
Graph 6 – Generation of plastic waste in Hungary, in thousands of tonnes.
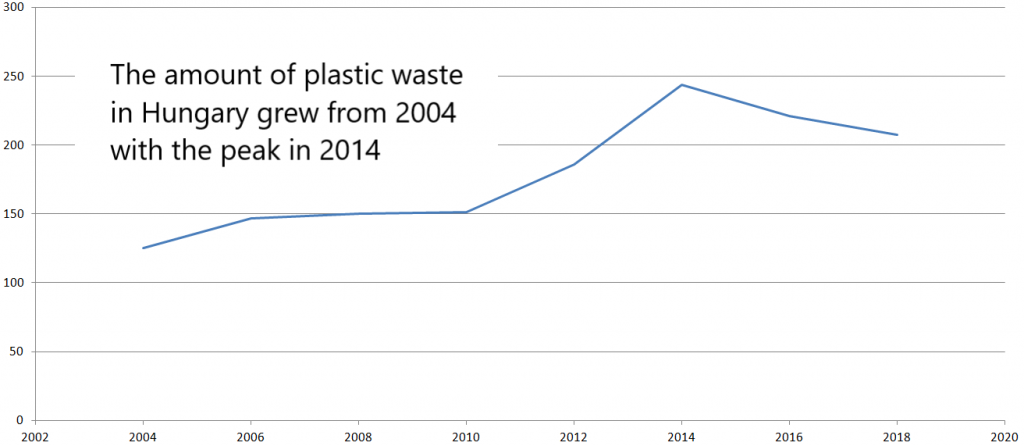
Graph 6 shows that the amount of plastic waste in Hungary grew from approximately 125 thousand tonnes in 2004 to about 244 thousand tonnes. However, in recent years the trend has slightly decreased. In 2018 it reached roughly 208 thousand tonnes.
According to PlasticsEupore, 21.4% of plastic waste was recycled in 2014 in Hungary, while the energy recovery accounted for 21.5%. Unfortunately, 57.1% of plastic waste was landfilled. However, Hungary has a waste policy and legal frameworks, which helps to improve the situation. Recently a new landfill tax was introduced, and the use of product fees has been extended.